What Is a Good CTR in Search Console? Our Data by Position
What is a good CTR in Google Search Console? Our three sites: 1.6% to 2.2% overall, and position 1 at 3.4%, below positions 2 and 3. How to judge yours.

By Tyler Phan7 min readLast reviewed
Part of our guide to Search Console and GA4
On this page
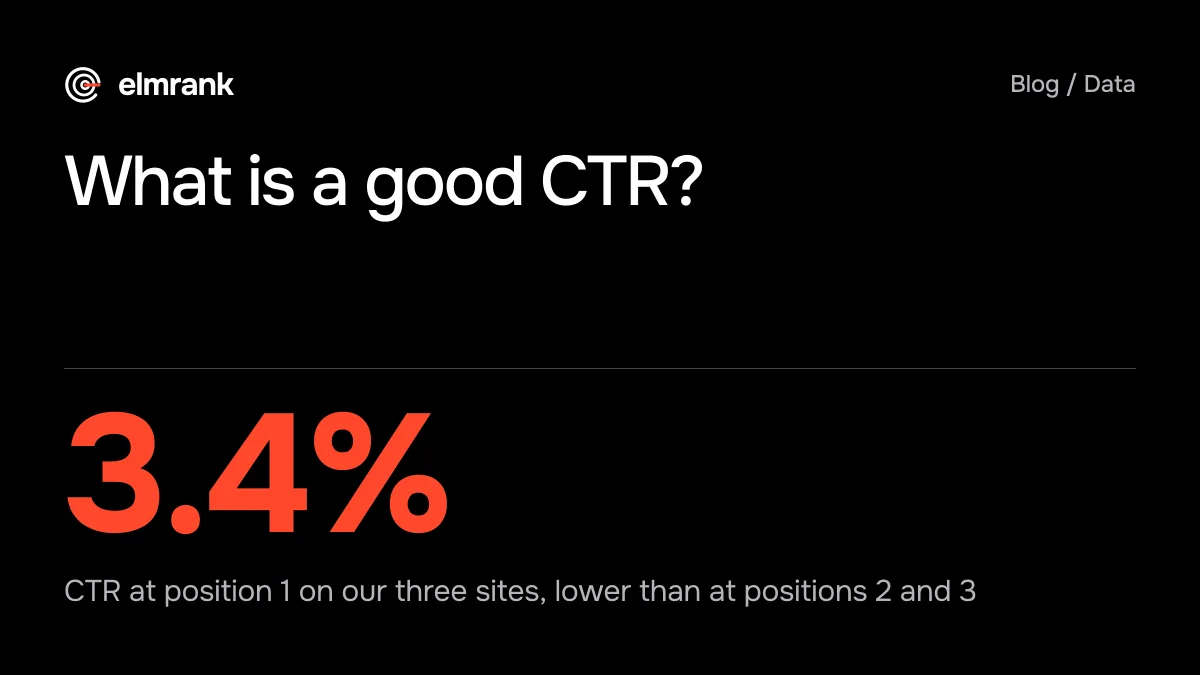
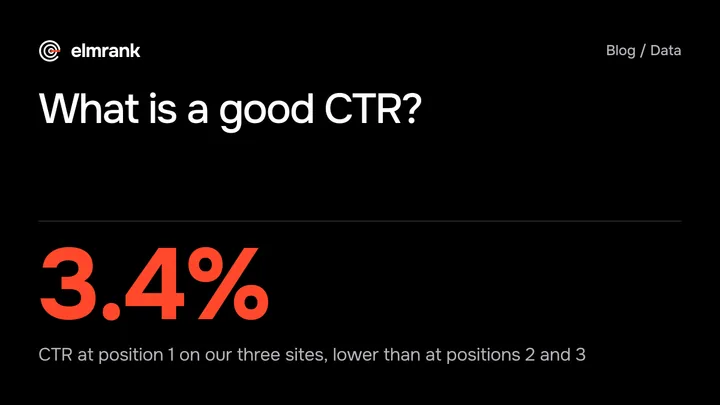
A good CTR in Search Console is one that's normal for your position, your kind of query and what else Google shows on the page, so a single target number doesn't exist. On the three sites we run, the click-through rate for the four weeks to October 19, 2026 was 2.2%, 1.6% and 2.1%. Results in position 1 got 3.4% of their impressions as clicks. Positions 2 and 3 got more: 5.5% and 5.9%.
That last part surprised us, so this post shows how we counted, why position 1 can lose to position 3, and how to judge your own CTR against your own numbers instead of someone else's.
What Search Console means by CTR and position
Search Console defines click-through rate as "the calculation of (clicks ÷ impressions)." The tricky number is position. Google calls it "a relative ranking of the position of your link on Google, where 1 is the topmost position," and adds that "a position number can mean different things in different situations, and so you should not make simple assumptions."
Three details from the same help page matter when a CTR looks odd:
- "Each element in Search results occupies a single position, whether it contains a single link or many different links or child elements." A carousel or a knowledge panel takes one position for all of its links.
- Some images count. "Some image thumbnails in the main search page do (eventually) lead to a web page (perhaps after an extra click to expand it), and so count as a position placeholder."
- Some taps aren't clicks. Search Console counts a click when it sends someone "to a page outside of Google Search, Discover, or News"; "clicking a link that stays inside the Google platform is not counted as a click."
So "position 1" can be a plain blue link at the top of the page, or an element where a tap may never leave Google.
Our CTR by position
We pulled every row Search Console gives for the three sites (a manhwa and anime site, a game news site and a card game site, all ours) from September 22 to October 19: one row per day, query and device, web search only, final data. We rounded each row's average position to a whole number, grouped the rows and divided clicks by impressions. Queries containing a site's own name are left out; there were 43 impressions of those.
| Position | CTR | Impressions |
|---|---|---|
| 1 | 3.4% | 36,199 |
| 2 | 5.5% | 36,018 |
| 3 | 5.9% | 36,004 |
| 4 | 4.9% | 51,900 |
| 5 | 3.3% | 51,347 |
| 6 | 2.3% | 83,433 |
| 7 | 1.7% | 80,709 |
| 8 | 1.0% | 106,834 |
| 9 | 0.6% | 92,890 |
| 10 | 0.4% | 88,679 |
| 11 to 20 | 0.8% | 51,340 |
From position 3 down, CTR falls the way you'd expect, by about half every two positions and then faster, to 0.4% at position 10. Positions 11 to 20 came out at 0.8%, above positions 9 and 10, and we haven't looked into why. On phones and on computers alike, position 1 sits below positions 2 to 4, so device doesn't explain the dip.
Look at where the impressions sit, too. In the rows with a query, positions 4 to 10 had 76% of the impressions and 62% of the clicks, and positions 1 to 3 had 15% of the impressions and 35% of the clicks. Those rows hold about a third of the three sites' impressions, so the split may differ for the rest. Still, it's one reason an overall CTR around 2% isn't a warning sign on these sites: among the queries Search Console names, most results sit in the lower half of page one.
Why our position 1 gets fewer clicks than position 3
Position 1 on its own differs a lot by site: 2.1% on the manhwa site, 5.2% on the game news site and 1.5% on the card game site. Search Console can't tell us what kind of result each one was, so here is what we can and can't say.
On the manhwa site, one query brought 24% of all position-1 impressions and got 2 clicks. Without it, the site's position-1 CTR rises from 2.1% to 2.7%, still below its positions 2 to 4. On the other two sites, no single query carried more than 7% of them.
Many of our largest position-1 queries are the name of a series, a game or a card, or ask for a release date. Our guess is that many people searching a name want the official page or the thing itself, and a date can be answered on the results page.
Going by Google's rules above, a position-1 result can also be an image or a panel where taps stay inside Google and don't count as clicks. We can't confirm which result types we held.
AI Overviews take clicks too. Advanced Web Ranking's report for April to June 2026 (US data) found that on mobile, "ranking first in Q2 means receiving 35.95% of the clicks in an AIO-free SERP and only 8.51% when AI Overviews are present." Search Console gives us no AI Overview filter (the search appearance types it lists for our sites are review snippets, product snippets and translated results), so we can't split our numbers that way.
Our 3.4% at position 1 is below even AWR's AI Overview figure. That's the main reason we don't use published CTR curves as targets. They average other people's queries on other people's results pages.
Most of our clicks come from queries Search Console doesn't name
The position table above covers only the rows Search Console shows with a query. Those were 43% of the manhwa site's clicks, 36% of the game news site's and 17% of the card game site's. The rest comes from what Google calls anonymized queries, "those that aren't issued by more than a few dozen users over a two-to-three month period." Google leaves them out of the query table but keeps them in the chart totals.
So on our sites, a query-level CTR table describes a minority of the clicks. The site totals include everything, but they mix every position together. When you report CTR, say which of the two you mean.
How to tell whether your CTR is good
- 1Build your own curveLast 28 days, CTR by rounded position, from your query rows
- 2Find pages below itSame position, a fraction of the CTR your other pages get
- 3Split it upPhones and computers, names and questions, checked separately
- 4Look at the results pageAI Overview, images, a panel, a carousel above you?
The curve needs every query row you can get. We pull them with the Search Console API, which returns up to 25,000 rows per request ("Valid range is 1–25,000") and pages through the rest with startRow: one row per date, query and device, web search only. Round each row's position, add up clicks and impressions per position, and divide. If a position has only a few hundred impressions, merge it with its neighbours (1 to 3, 4 to 6) before you compare pages with it.
A page's CTR is worth a look when it's far below your own curve at the same position, not when it misses a benchmark. In our sample report, five rules explainers on the card game site got a 0.3% CTR in September at positions 6.3 to 7.7, which round to 6, 7 and 8. Across our three sites, positions 6 to 8 earn 1.0% to 2.3% in the table above, so those pages got between a third and a seventh of that. A gap that size is what gets a group of pages named in our report. The report also says we don't know why yet: our guess is AI Overviews, and we haven't checked it.
Before you rewrite a title to fix CTR, search the query yourself, in an incognito window and on a phone. If an AI Overview, a video block or a panel sits above your result, a better title may not change much. If your result is a plain link with a vague title, it might.
Where CTR sits in our reports
CTR goes in our monthly report next to clicks, impressions and position, for the site and for groups of pages, as in the sample report. We read it against the site's own past months and point out groups of pages that fall far below the rest. For why we take these numbers from Search Console and not GA4, see our post on Search Console vs Google Analytics. For what else belongs in a report, see what a monthly SEO report should include.
The SEO content service page lists what we write and how each article is checked. The plan is $500 for the first month and $300 a month after. To see what we'd fix first on your site, send it to us: the list is free, and we reply within 12 hours.
How we know this
Written by Tyler Phan. Every source below was read on the date shown; the page was last reviewed on Oct 24, 2026.
- Search Console Help, What are impressions, position, and clicks?, accessed Oct 22, 2026
- Google Search Central Blog, A deep dive into Search Console performance data filtering and limits (October 2022), accessed Oct 22, 2026
- Advanced Web Ranking, Google CTR Stats: Changes Report for Q2 2026, accessed Oct 22, 2026
- Google for Developers, Search Console API: Search Analytics query, accessed Oct 22, 2026
- Elmrank, Search Console performance data (web search, by day, query and device) for the three sites we run, September 22 to October 19, 2026, pulled October 22, accessed Oct 22, 2026
- Elmrank, sample monthly report (card game site, September 2026), accessed Oct 22, 2026
Send us your site.
We reply within 12 hours with what we'd fix first. Then we run it for you, technical SEO and content: $500 for the first month, then $300 a month for up to 30 articles. You don't need any technical knowledge, and you can cancel any time.