Average Position in Search Console, Explained With Our Data
Average position in Search Console is your site's topmost spot per search, averaged over impressions. On our three sites: 6.3 to 7.6. How we read it.

By Tyler Phan7 min readLast reviewed
Part of our guide to Search Console and GA4
On this page
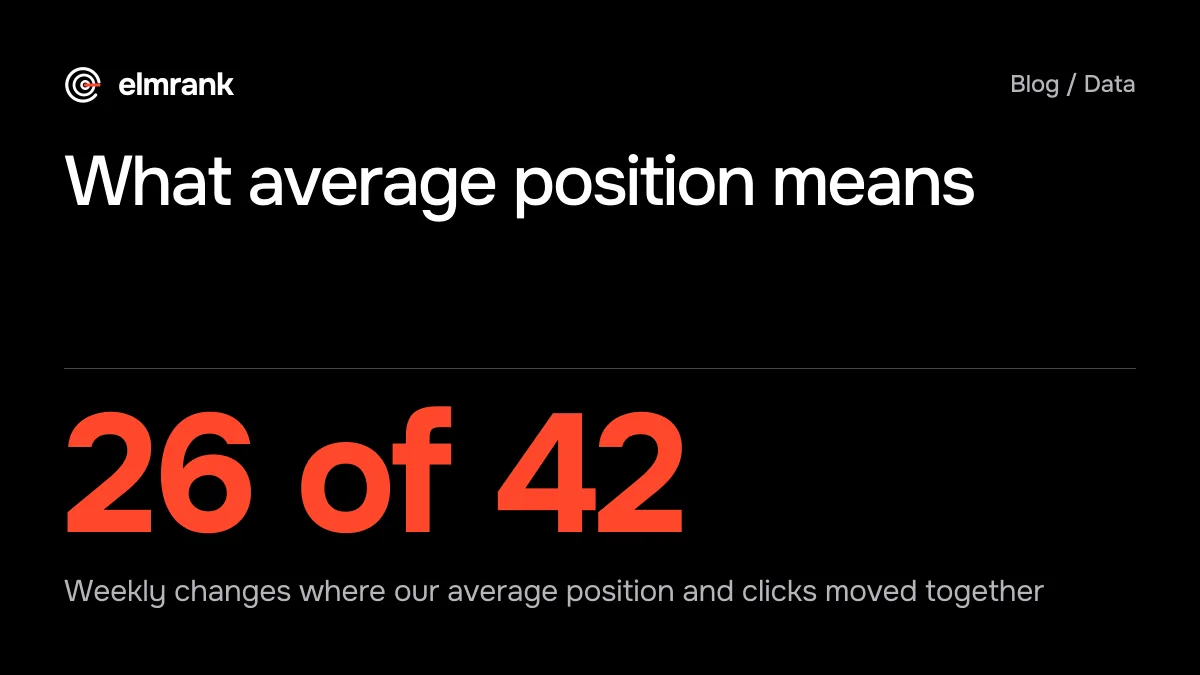
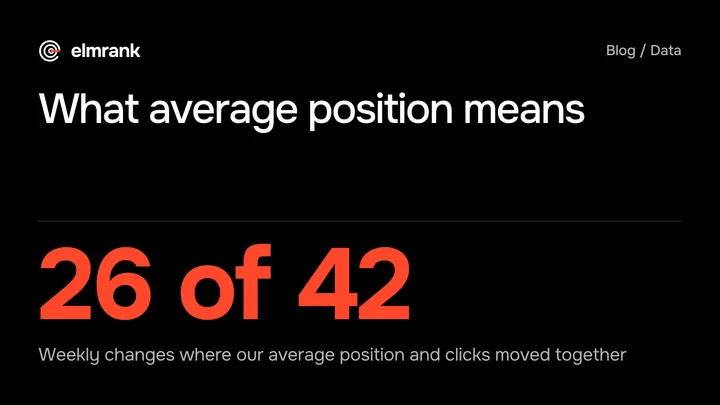
Average position in Google Search Console is the highest spot your site held in each search, averaged over every impression. On the three sites we run, it was 6.3, 7.6 and 7.4 for the four weeks to October 19, 2026. When we lined up 42 week-on-week changes since July, average position and clicks moved together 26 times and apart 16 times. So the number leans the same way as clicks, but not reliably, and the weeks where it doesn't are the ones worth reading closely.
This post covers how Google calculates the number, what moved it on our sites, and how we read it in our own reports.
How Search Console calculates average position
Google's help page puts it this way: "The position value shown in the Performance report is the topmost position occupied by a link to your property or page in search results, averaged across all queries in which your property appeared." Its example: if one search shows your site at positions 2, 4 and 6, and another at 3, 5 and 9, the two count as 2 and 3, and the average is 2.5. Elsewhere on the same page Google says the metric "averages the position value for all impressions," so a query that was searched a thousand times weighs a thousand times as much as one searched once.
Three details explain most of the surprises:
- Unseen results don't count. "A link must get an impression for its position to be recorded." If your page sits on page three and the searcher never gets there, that search adds nothing to your average.
- The chart and the table measure different things. In the chart, the value is "the average position of the topmost result from your entire site." In the table, it's "the average position in Search results for the specific URL or grouping dimension shown in the table row," and Google's Performance report help adds that data grouped by page "is aggregated by page." Two of your pages in one search count once in the chart and once each in the Pages table.
- Your own search is one search. Google says your position "might be different than the average because of many variables, such as your search history, location, and so on."
Our three sites: 6.3 to 7.6
We pulled Search Console's daily totals for the three sites (a manhwa and anime site, a game news site and a card game site, all ours) from September 22 to October 19, 2026, web search, final data, split by device. Each figure below is the average weighted by impressions, which is what the Search Console chart shows for the same dates.
| Site | Average position | Phones | Computers |
|---|---|---|---|
| Manhwa site | 6.3 | 6.3 | 6.4 |
| Game news site | 7.6 | 7.3 | 7.7 |
| Card game site | 7.4 | 6.9 | 8.4 |
The card game site sat 1.5 places lower on computers than on phones. On the other two sites the gap was only 0.1 and 0.4. Where it's as wide as on the card game site, a shift in your traffic mix between devices moves the site average even when no single result does.
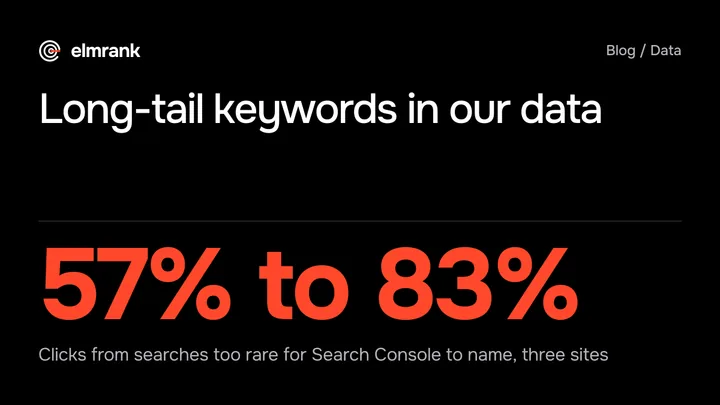
The average also hides how spread out the positions are. In the rows where Search Console names the query, 71% to 78% of each site's impressions were at positions 4 to 10, and 11% to 21% at positions 1 to 3. Those named rows held only 20% to 36% of each site's impressions. The rest belong to what Google calls anonymized queries, "those that aren't issued by more than a few dozen users over a two-to-three month period," which are left out of the query table but kept in the chart. On the card game site the named queries averaged 9.7, more than two places below the site's 7.4. So the queries you can see in the table aren't a fair sample of the ones you can't.
A few deep results pull the average down
Most of the card game site's named-query impressions sat on page one, but 7% were at position 21 or lower. Leave those out and the named queries average 7.2 instead of 9.7. Seven percent of the impressions moved the average by more than two places.
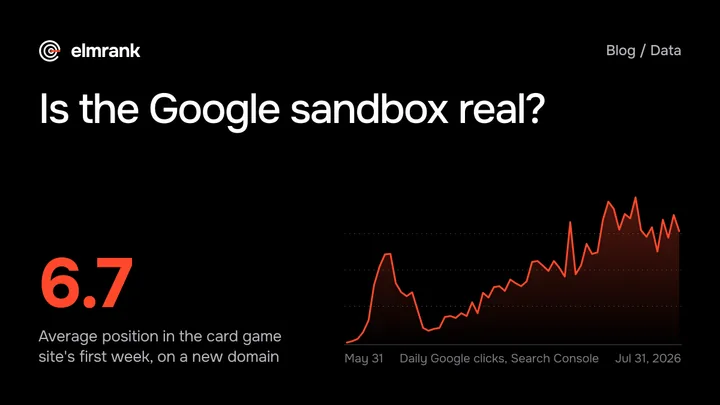
A new site shows the same effect at full size. On elmrank.com's first day in Search Console, 4 impressions averaged position 30.2. The next day, with 27 pages showing instead of 4, the average was 70.5; we walk through those days in how to tell if your SEO company is working. Google had started trying far more of our pages for far more queries, most of them deep in the results, and the average number climbed with them.
When average position and clicks disagree
We took each site's Monday-to-Sunday weeks from July 6 to October 18 and compared each week with the one before: 42 changes across the three sites. In 26 of them, average position and clicks moved the way you'd expect, a better position with more clicks or a worse one with fewer. In the other 16 they moved apart. If the two numbers had nothing to do with each other, we'd expect about 21 of each, so 42 changes lean toward moving together but aren't enough to rule out chance: a split this lopsided turns up about one time in six by chance alone. Clicks also rise and fall with how many people search, and the average shifts with which searches your pages show up for.
Two weeks in October show why. We compared October 12 to 18 with October 5 to 11, query by query, using the rows Search Console names.
On the card game site the average got worse, from 7.6 to 8.1, and clicks rose 12%, from 952 to 1,069. Underneath, the 1,233 queries that appeared in both weeks did slip, from 9.2 to 10.3, and their clicks fell from 118 to 68. Queries that were new that week brought 91 clicks. The worse average was partly real, and the extra clicks came from somewhere else.
On the game news site the average barely moved, from 7.60 to 7.54. The 8,401 queries present in both weeks slipped from 8.0 to 8.2 and lost 15% of their clicks, from 1,836 to 1,558. The average held because queries that had averaged 11.7 dropped out, and new ones arrived at 8.9 and brought 274 clicks. Read alone, the site average would have told us nothing happened.
- Position and clicks moved the expected way, weekly changes 1, 2, 3, 4, 5, 6, 7, 8, 9, 10, 11, 12, 13, 14, 15, 16, 17, 18, 19, 20, 21, 22, 23, 24, 25 and 26
- They moved in opposite directions, weekly changes 27, 28, 29, 30, 31, 32, 33, 34, 35, 36, 37, 38, 39, 40, 41 and 42
How we read average position
- 1Filter firstOne query, one page or one group of pages, one device
- 2Keep the same queriesCompare only queries that appear in both periods
- 3Read it with clicksMore impressions and a worse average often means new, deeper queries
- 4Look at the spreadShare of impressions at 1 to 3, 4 to 10 and 11 to 20
In the Performance report, set two date ranges with Compare, open the Queries tab with a page or folder filter, and export both columns. Keep the queries that have impressions in both periods and compare their positions; set the new and lost queries apart. Google notes that the report's tables "can show a maximum of 1,000 rows," so for a site or folder with more queries than that, do the comparison through the API. There you can pull one row per date, query and device, which is how we got the numbers above, and the response tells you whether rows were aggregated "byPage" or "byProperty."
For a single query the number is easier to judge, because a position maps to clicks. In our post on what a good CTR is in Search Console, positions 2 and 3 got 5.5% and 5.9% of impressions as clicks on our sites, and position 10 got 0.4%. A query that moves from 9 to 4 is worth noticing. A site average that moves from 7.6 to 8.1 needs the breakdown above before it means anything.
Where average position sits in our reports
Our monthly report lists average position for the site and for groups of pages, next to clicks, impressions and CTR, and says when the position held while clicks fell, as in our sample report, where September's average hardly moved and clicks dropped because fewer people searched for what the pages cover. For what else a report should hold, see what a monthly SEO report should include.
The SEO content service page lists what we write and how each article is checked. The plan is $500 for the first month and $300 a month after. To see what we'd fix first on your site, send it to us: the list is free, and we reply within 12 hours.
Questions
What is a good average position in Google Search Console?
There isn't one number to aim for at site level, because the average mixes every query the site appeared for. Our three sites averaged 6.3, 7.6 and 7.4 over four weeks and got 1.6% to 2.2% of their impressions as clicks. For a single query it's simpler: on our sites positions 2 and 3 got the most clicks per impression, and by position 10 it was 0.4%.
Why did my average position get worse while my clicks went up?
Usually because Search Console started showing your pages for new queries, often lower down, and the average now includes them. In the week of October 12 our card game site's average went from 7.6 to 8.1 while its clicks rose 12%. The queries it had both weeks did slip, and their clicks fell from 118 to 68; queries new that week brought 91 clicks.
Why is the position in Search Console different from what I see when I search?
Search Console averages your topmost position over every impression, from every searcher. Google says that for your own search the position "might be different than the average because of many variables, such as your search history, location, and so on." A phone and a computer can also differ: on our card game site the average was 6.9 on phones and 8.4 on computers.
How we know this
Written by Tyler Phan. Every source below was read on the date shown; the page was last reviewed on Oct 26, 2026.
- Search Console Help, What are impressions, position, and clicks?, accessed Oct 22, 2026
- Search Console Help, About Search Console data, accessed Oct 22, 2026
- Search Console Help, Performance report (Search results), accessed Oct 22, 2026
- Google Search Central Blog, A deep dive into Search Console performance data filtering and limits (October 2022), accessed Oct 22, 2026
- Google for Developers, Search Console API: Search Analytics query, accessed Oct 22, 2026
- Elmrank, Search Console performance data (web search, by day, device and query) for the three sites we run, September 22 to October 19, 2026, pulled October 22, and their daily totals since launch, accessed Oct 22, 2026
Send us your site.
We reply within 12 hours with what we'd fix first. Then we run it for you, technical SEO and content: $500 for the first month, then $300 a month for up to 30 articles. You don't need any technical knowledge, and you can cancel any time.